Code
# To clean data
library(tidyverse)
library(lubridate)
library(janitor)

# To scrape data
library(rvest)
library(httr2) # API
library(polite)
library(jsonlite) # Extract the data
library(patchwork) # side by side plots# To clean data
library(tidyverse)
library(lubridate)
library(janitor)
# To scrape data
library(rvest)
library(httr2) # API
library(polite)
library(jsonlite) # Extract the data
library(patchwork) # side by side plotsI have recently gotten access to a garden. After being a bit kamikaze with a hedge trimmer, clearing ivy, brambles and bamboo roots - it is time to start thinking about what to put in it. If you want to skip the why I am webscraping plant data - skip to the webscrape section, otherwise buckle up for a ramble about garden challenges!
Realistically this is a multi-year project which will never be finished, subject to many changing external factors1. I have to be patient and see what happens!
1 Just like a PhD really!
Now the garden. It is north-west facing so receives sun in the afternoon. The main bed ready to planted (aka been annihilated from brambles, a dodgy thuja (non-native) shrub-going-on-tree, enormous ivy roots) is in the shade, pretty much all the shade, permanently/all year-round so far. This is the main focus at the moment.
The other bed at the end of the garden is partially sunny/full sun raised bed. In it I have already planted a reduced-to-clear clematis (having the time of it’s life). My plan for there is a rose in the partially shady area. I want to make a bed on the sunny side (more brambles to grapple with, a holly, and a baby hawthorn). Then is a small tree and an old wirey hardy rosemary bush I’ve propped up with bamboo but feels as exhausted as I do.
Here is a plan of the garden before and after


Solution! I do not have lots of money to spend on (spenny) mature plants. I am not too impatient to start by seed, but I have missed the boat and I would like to enjoy something in the garden this summer! So the solution: bare roots, perennials.
Speaking to gardening folk, not a common tactic to go, bar maybe Peonies or Dahlias, quite uncommon. So it is a bit of an adventure!
Why perennials? I would like a garden to maintain, and I like the idea of things coming back, year after year, maybe with a little encouragement!
Thus, I went shopping and I bought some bare roots perennials!
As a biologist, I feel I should know a little about plants, but often this is not in a way a gardener cares and grows them. Also I specialise in animal behaviour and social networks… so quite different!
With my order, the website has lots of information. I don’t want to be clicking into it every time to see when I should plan x, y and z.
Hence, I want to webscrape all the information from my order, into a spreadsheet.
And here is how I did it.
csvFirst I download the order confirmation. I put it into a csv but it’s not going to work with readr, as not a csv. Instead I need to read lines. Here is the first 5 lines2
2 Yucky.
input_order <- readr::read_lines("data/input_root_order.csv")
head(input_order)
[1] "Gillenia trifoliataproductThumbnailQuantityLabel"
[2] "1"
[3] "Gillenia trifoliata"
[4] "1 bare root"
[5] "WS8R9FWSGM"
[6] "(-£0.22)" Next we filter out only lines with flower names and bare root counts as I only want the plant information!
We assume flower names have alphabetic characters and possibly single quotes, and that the bare root count lines contain “bare root” or “tuber” or “corms” so I can figure out how much I actually have to plant.
# detect just text of flower names with no added snazzy-ness
flower_lines <- input_order[str_detect(input_order, "[A-Za-z]") & !str_detect(input_order, "bare root|Thumbnail|Label|WS|£|tuber|corms|Free|Farmer")]

# find the quantity
bare_root_lines <- input_order[str_detect(input_order, "bare root|tuber|corms")] # or tuber or corms

# Combine into a data frame
df <- tibble(
  flower_name = flower_lines,
  bare_roots = bare_root_lines
)

print(df)
# A tibble: 24 × 2
flower_name bare_roots
<chr> <chr>
1 Gillenia trifoliata 1 bare root
2 Echinacea 'Blackberry Truffle' 1 bare root
3 Iris 'Just Around Midnight' 1 bare root
4 Dahlia 'Labyrinth' 1 tuber
5 Dahlia 'Café au Lait' 1 tuber
6 Anemone 'Whirlwind' 1 bare root
7 Anemone 'September Charm' 1 bare root
8 Allium 'Millenium' 3 bare roots
9 Tricyrtis 'Blue Wonder' 3 bare roots
10 Gypsophila paniculata 5 bare roots
# ℹ 14 more rowsNow we have a nice neat data frame of what I have ordered.
Which means I have
Using an inspect on Chrome, the information I want is in the “Specs and Info” section. Let’s try with a Dahlia ‘Cafe au Lait’ first:
dahlia_cafe_url <- "https://www.farmergracy.co.uk/products/dahlia-cafe-au-lait-tubers-uk"
dahlia_cafe_url_bow <- polite::bow(dahlia_cafe_url)
dahlia_cafe_html <-
  polite::scrape(dahlia_cafe_url_bow) %>%
  html_elements(".information__list .information__item") # through inspect on chrome

titles <- html_elements(dahlia_cafe_html, ".information__item__title") %>% html_text2()
values <- html_elements(dahlia_cafe_html, ".information__item__content") %>% html_text2()

info_df <- tibble(
  title = titles,
  value = values
)
info_df %>% pivot_wider(names_from = title, values_from = value)
# A tibble: 1 × 24
`Botanical name` `Flower colour` `Tuber size` `Established height`
<chr> <chr> <chr> <chr>
1 Dahlia 'Café au Lait' Cream, pink 1 1-1.2m
# ℹ 20 more variables: `Established spread` <chr>, `Plant spacing` <chr>,
# `Leaf colour` <chr>, Habit <chr>, `Life cycle` <chr>, Hardiness <chr>,
# `Years to establish` <chr>, Sunlight <chr>, Position <chr>,
# `Suitable for` <chr>, `Soil acidity` <chr>, `Soil moisture` <chr>,
# `Soil type` <chr>, `Growing skill` <chr>, Scented <chr>,
# `Pollinator-friendly` <chr>, `Mouse resistant` <chr>,
# `Rabbit resistant` <chr>, `Deer resistant` <chr>, Toxicity <chr>That gets the information and the column names should (in theory) stay the same.
Next we prepare a list of URLs structure for all plants in the table:
df <- df %>% mutate(url =
              paste0("https://www.farmergracy.co.uk/products/",
              str_remove_all(str_replace_all(str_to_lower(flower_name), ' ', '-'),"'"),
              str_replace_all(str_remove_all(str_remove_all(bare_roots, '[0-9]'), '[$s]'), ' ', '-'),
              "s-uk"))
Then we loop through each url to extract the data. As polite bow adds a delay, it will take sometime deliberately!
website_data <- list()
    # trial and testing had to manually amend some of the urls
df[3,3] <- "https://www.farmergracy.co.uk/products/iris-chrysographes-just-around-midnight-bare-roots-uk"
df[12,3] <- "https://www.farmergracy.co.uk/products/gladiolus-pink-lightning-bulbs-uk"
df[13,3] <- "https://www.farmergracy.co.uk/products/peony-sorbet-bare-roots-uk"
df[21,3] <- "https://www.farmergracy.co.uk/products/astrantia-pink-pride-bare-roots"

for (i in df$url) {
  url_bow <- polite::bow(i)

  html <- polite::scrape(url_bow) %>%
    html_elements(".information__list .information__item") # through inspect on chrome

  titles <- html_elements(html, ".information__item__title") %>% html_text2()
  values <- html_elements(html, ".information__item__content") %>% html_text2()

  info_df <- tibble(
    title = titles,
    value = values
  )

  website_data[[i]] <- info_df %>%
    pivot_wider(names_from = title, values_from = value)
}
All that is left to do is to take the list and convert it into a table:
website_info_table <- dplyr::bind_rows(website_data)Fantastic. Now to figure out which to plant where, I need to figure out the height classes, so I don’t plant a big plant infront of another!
Lets recap this workflow as flowchart
Silly me! I forgot to check when everything needs to be planted by - I might have to do it all at once! On the website, using web inspector, there is a table with active and inactive squares. First with Dahlia as a test, lets extract this:
dahlia_cafe_url <- "https://www.farmergracy.co.uk/products/dahlia-cafe-au-lait-tubers-uk"
dahlia_cafe_url_bow <- polite::bow(dahlia_cafe_url)

planting_row_dc <- polite::scrape(dahlia_cafe_url_bow) %>%
  html_node(".product-calendar__table") %>%
  html_nodes("tr")
planting_row_dc
{xml_nodeset (3)}
[1] <tr>\n<th class="product-calendar__months label-medium weight-medium">Jan ...
[2] <tr>\n<td class="planting-item">\n </td>\n<td class="plantin ...
[3] <tr>\n<td class="flowering-item">\n </td>\n<td class="flower ...2nd row is planting and 3rd row is flowering timing.
# Extract each td in the planting row
planting_active_dc <- planting_row_dc %>% .[2] %>%
  html_nodes("td") %>%
  html_attr("class") %>%
  grepl("--active", .)

flowering_active_dc <- planting_row_dc %>% .[3] %>%
  html_nodes("td") %>%
  html_attr("class") %>%
  grepl("--active", .)

# Assign months
months <- month.name

# Combine
planting_calendar <- data.frame(
  Month = months,
  Planting = planting_active_dc,
  Flowering = flowering_active_dc
)

print(planting_calendar)
Month Planting Flowering
1 January FALSE FALSE
2 February TRUE FALSE
3 March TRUE FALSE
4 April TRUE FALSE
5 May TRUE FALSE
6 June TRUE FALSE
7 July FALSE TRUE
8 August FALSE TRUE
9 September FALSE TRUE
10 October FALSE TRUE
11 November FALSE FALSE
12 December FALSE FALSENice! But I need all of the plants… Once again back to a loop to see how screwed I am:
# cache: True
plant_flower_table <- list()
for (i in df$url) {
  url_bow <- polite::bow(i)

  planting_flowering_info <-  polite::scrape(url_bow) %>%
    html_node(".product-calendar__table") %>%
    html_nodes("tr")

  # Extract each td in the planting row
  planting_active <- planting_flowering_info %>% .[2] %>%
    html_nodes("td") %>%
    html_attr("class") %>%
    grepl("--active", .)

  flowering_active <- planting_flowering_info %>% .[3] %>%
    html_nodes("td") %>%
    html_attr("class") %>%
    grepl("--active", .)

  # Assign months
  months <- month.name

  # Combine
  plant_flower_table[[i]] <- data.frame(
    Month = months,
    Planting = planting_active,
    Flowering = flowering_active
  )
}

# combine, label with url
plant_flower_table_long <- bind_rows(plant_flower_table, .id = "url")
glimpse(plant_flower_table_long)
Rows: 288
Columns: 4
$ url <chr> "https://www.farmergracy.co.uk/products/gillenia-trifoliata-…
$ Month <chr> "January", "February", "March", "April", "May", "June", "Jul…
$ Planting <lgl> FALSE, TRUE, TRUE, TRUE, TRUE, TRUE, FALSE, FALSE, FALSE, FA…
$ Flowering <lgl> FALSE, FALSE, FALSE, FALSE, FALSE, FALSE, TRUE, TRUE, TRUE, …Each row is a month and flower combination with true or false for planting and flowering. In other words the data is in a long format. This is great for plotting but in my opinion, hard for human brain to comprehend.
So how much do I have to panic in the next couple of weeks?
I am going to plot this out. I first am going to change months to numbers so easier to plot later on. I am also going ot add the flower name so I can use that instead of the URL.
plant_flower_table_long <- plant_flower_table_long %>%
  mutate(
    Month_num = match(Month, month.name)
  ) %>% right_join(select(df, url, flower_name),
                   join_by(url))
head(plant_flower_table_long)
url
1 https://www.farmergracy.co.uk/products/gillenia-trifoliata-bare-roots-uk
2 https://www.farmergracy.co.uk/products/gillenia-trifoliata-bare-roots-uk
3 https://www.farmergracy.co.uk/products/gillenia-trifoliata-bare-roots-uk
4 https://www.farmergracy.co.uk/products/gillenia-trifoliata-bare-roots-uk
5 https://www.farmergracy.co.uk/products/gillenia-trifoliata-bare-roots-uk
6 https://www.farmergracy.co.uk/products/gillenia-trifoliata-bare-roots-uk
Month Planting Flowering Month_num flower_name
1 January FALSE FALSE 1 Gillenia trifoliata
2 February TRUE FALSE 2 Gillenia trifoliata
3 March TRUE FALSE 3 Gillenia trifoliata
4 April TRUE FALSE 4 Gillenia trifoliata
5 May TRUE FALSE 5 Gillenia trifoliata
6 June TRUE FALSE 6 Gillenia trifoliata# Plot for Planting
planting_plot <- plant_flower_table_long %>%
filter(Planting) %>%
ggplot(aes(x = Month_num, y = flower_name)) +
geom_tile(fill = "seagreen3", height = 0.8) +
scale_x_continuous(breaks = 1:12, labels = month.abb, limits = c(1,12)) +
labs(title = "Planting", x = "Month", y = "Plant") +
theme_minimal() +
theme(axis.text.x = element_text(angle = 45, hjust = 1),
plot.title=element_text( hjust=0.5, face='bold'),
panel.background = element_rect(fill = NA, color = NA),
plot.background = element_rect(fill = NA, color = NA))
# Plot for Flowering
flowering_plot <- plant_flower_table_long %>%
filter(Flowering) %>%
ggplot(aes(x = Month_num, y = flower_name)) +
geom_tile(fill = "gold", height = 0.8) +
scale_x_continuous(breaks = 1:12, labels = month.abb, n.breaks = 12,limits = c(1,12)) +
labs(title = "Flowering", x = "Month", y = "Plant") +
theme_minimal() +
theme(axis.text.x = element_text(angle = 45, hjust = 1),
plot.title=element_text( hjust=0.5, face='bold'),
axis.text.y = element_blank(), axis.title.y = element_blank(),
panel.background = element_rect(fill = NA, color = NA),
plot.background = element_rect(fill = NA, color = NA)
)
planting_plot + flowering_plot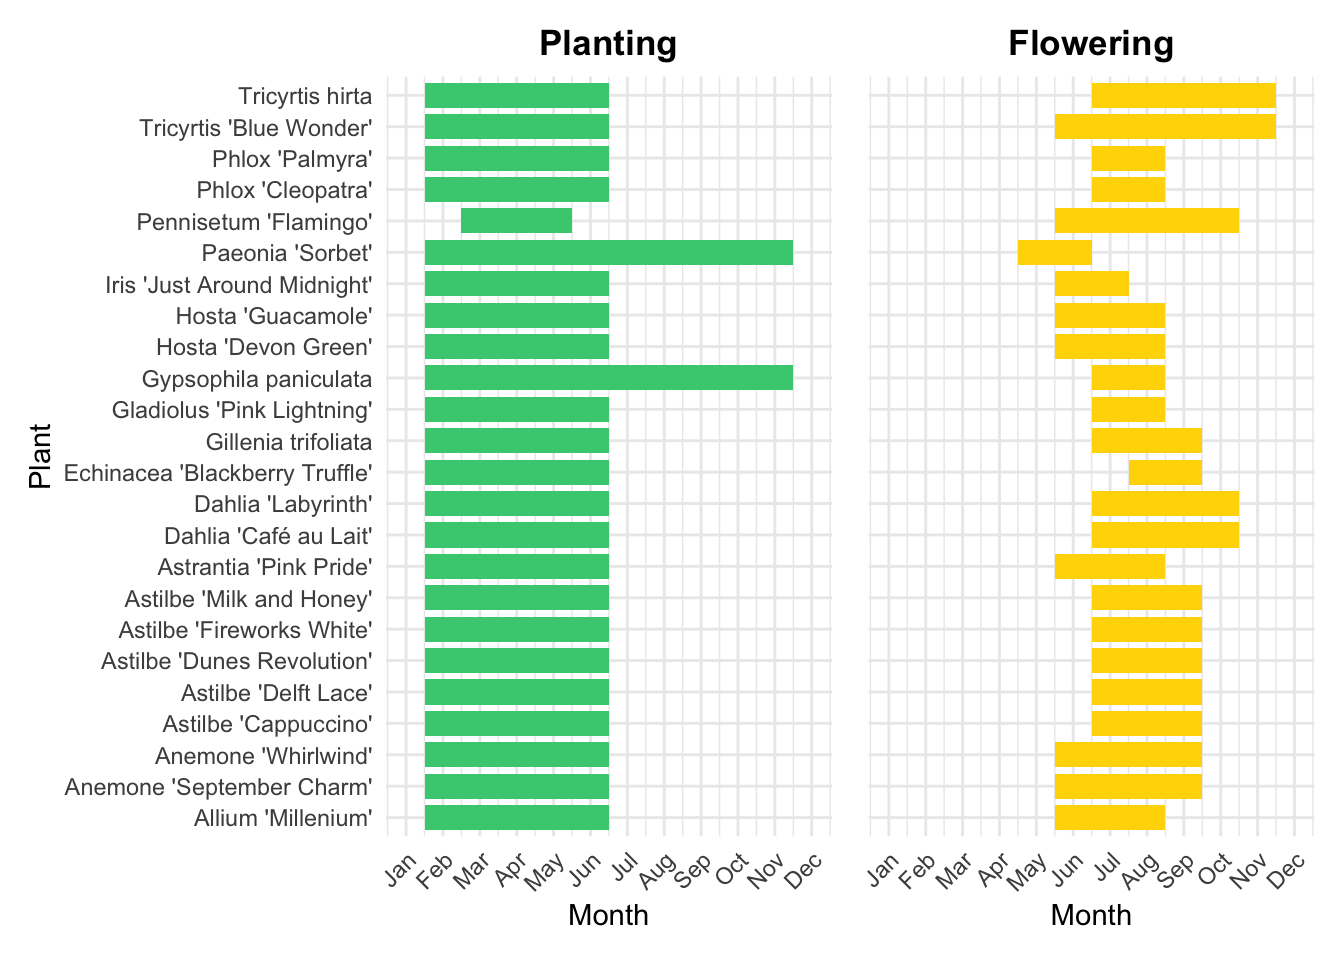
So effectively. Everything!
I am going to be busy!!!